Getting proper time series data from SQL can be challenging. It's best to create a proper datawarehouse and generate a calendar table, but I can show you how to create an ad-hoc calendar table for quick visualization in Grafana.
The Problem
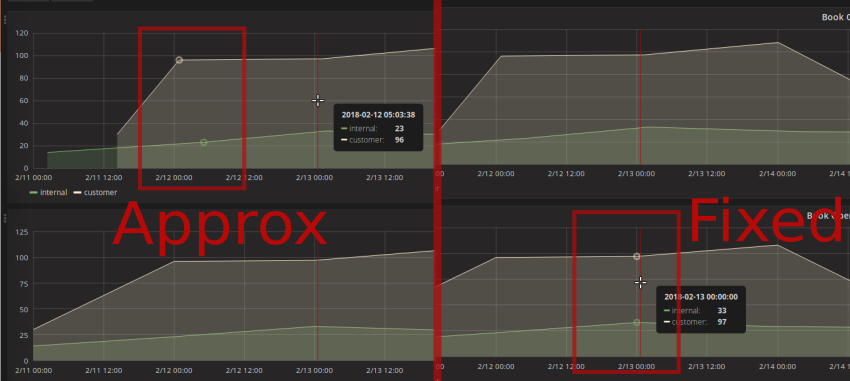
Grafana supports MySQL as a datasource, but the default query they give you doesn't really do a good job of filling in blank spots. If you are graphing 2 metrics, it's not guaranteed that your metrics will line up.
What you get
+------------+-------+----------+
| time_sec   | value | metric   |
+------------+-------+----------+
| 2018-02-12 |     1 | customer |
| 2018-02-13 |     1 | customer |
| 2018-02-14 |     8 | customer |
| 2018-02-15 |    24 | customer |
+------------+-------+----------+
What you want
+------------+-------+----------+
| time_sec   | value | metric   |
+------------+-------+----------+
| 2018-02-11 |     0 | customer |
| 2018-02-12 |     1 | customer |
| 2018-02-13 |     1 | customer |
| 2018-02-14 |     8 | customer |
| 2018-02-15 |    24 | customer |
| 2018-02-16 |     0 | customer |
| 2018-02-17 |     0 | customer |
+------------+-------+----------+
Here's their example:
SELECT
min(UNIX_TIMESTAMP(time_date_time)) as time_sec,
max(value_double) as value,
metric1 as metric
FROM test_data
WHERE   $__timeFilter(time_date_time)
GROUP BY metric1, UNIX_TIMESTAMP(time_date_time) DIV 300
ORDER BY time_sec asc
The DIV 300 attempts to group values into 5 minute buckets. And, while not awful, it doesn't guarantee that 2 metrics will line up on the same divisions.
Generating a list of dates
I found some SQL examples on stack overflow, but none of them were a compelte solution for Grafana.
select a.Date
from (
  select curdate() - INTERVAL (a.a + (10 * b.a) + (100 * c.a)) DAY as Date
  from (select 0 as a union all select 1 union all select 2 union all select 3 union all select 4 union all select 5 union all select 6 union all select 7 union all select 8 union all select 9) as a
  cross join (select 0 as a union all select 1 union all select 2 union all select 3 union all select 4 union all select 5 union all select 6 union all select 7 union all select 8 union all select 9) as b
  cross join (select 0 as a union all select 1 union all select 2 union all select 3 union all select 4 union all select 5 union all select 6 union all select 7 union all select 8 union all select 9) as c
) a
where a.Date between '2010-01-20' and '2010-01-24'
See: https://stackoverflow.com/a/2157776/380666
This solution only gives 100 resulting dates. That's fine for a monthly view, but it's not so adequate if we want to look at hourly data for an entire week.
What the solution is doing is creating a table of values for the 1s column, 10s column and 100s column of numbers, then adding them up in a loop. The union selects make sure that each successive number show up as another row and not another column. Let's select just the middle part:
select a.a as ones, b.a as tens, c.a as hundreds
  from (
                select 0 as a union all select 1 union all select 2 ... union all select 9) as a
    cross join (select 0 as a union all select 1 union all select 2 ... union all select 9) as b
    cross join (select 0 as a union all select 1 union all select 2 ... union all select 9) as c
limit 12;
+------+------+----------+
| ones | tens | hundreds |
+------+------+----------+
|    0 |    0 |        0 |
|    1 |    0 |        0 |
|    2 |    0 |        0 |
|    3 |    0 |        0 |
|    4 |    0 |        0 |
|    5 |    0 |        0 |
|    6 |    0 |        0 |
|    7 |    0 |        0 |
|    8 |    0 |        0 |
|    9 |    0 |        0 |
|    0 |    1 |        0 |
|    1 |    1 |        0 |
+------+------+----------+
12 rows in set (0.00 sec)
So this query looks promising. But, I found another one too:
select * from
(select adddate('1970-01-01',t4*10000 + t3*1000 + t2*100 + t1*10 + t0) gen_date from
  (select 0 t0 union select 1 union select 2 union select 3 union select 4 union select 5 union select 6 union select 7 union select 8 union select 9) t0,
  (select 0 t1 union select 1 union select 2 union select 3 union select 4 union select 5 union select 6 union select 7 union select 8 union select 9) t1,
  (select 0 t2 union select 1 union select 2 union select 3 union select 4 union select 5 union select 6 union select 7 union select 8 union select 9) t2,
  (select 0 t3 union select 1 union select 2 union select 3 union select 4 union select 5 union select 6 union select 7 union select 8 union select 9) t3,
  (select 0 t4 union select 1 union select 2 union select 3 union select 4 union select 5 union select 6 union select 7 union select 8 union select 9) t4) v
where gen_date between '2017-01-01' and '2017-12-31'
See: https://stackoverflow.com/a/2157776/380666
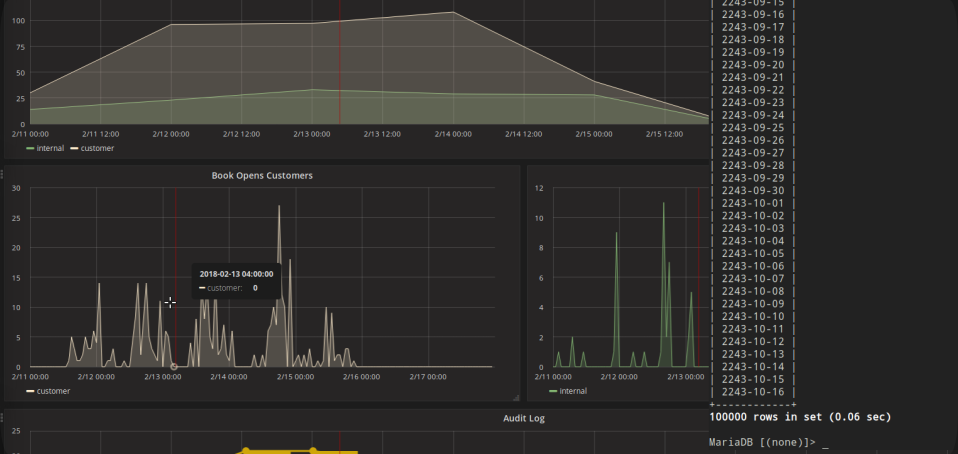
This statement will select 100,000 days! Enough for more than 200 years. That seems a tad excessive, but, we can easily trim down the 4th select, or remove it altogether. One thing this query is missing is the CROSS JOIN. So the date it generates are not in order because the columns of ones, tens, etc don't line up.
select * from
...
| 2243-10-14 |
| 2243-10-15 |
| 2243-10-16 |
+------------+
100000 rows in set (0.06 sec)
Making it work with Grafana
OK, so we have some queries that we can stitch together. All that's left is to throw our original SQLs on as a LEFT JOIN and replace some of the hard coded dates with Grafana variables/macros.
select UNIX_TIMESTAMP(v.gen_date) as time_sec,
  count(A.msg) as value,
    'internal-opens' as metric
  from
  (select DATE_ADD( $__timeFrom(), INTERVAL t4*10000 + t3*1000 + t2*100 + t1*10 + t0  DAY) gen_date from
   (select 0 t0 union select 1 union select 2 union select 3 union select 4 union select 5 union select 6 union select 7 union select 8 union select 9) t0
   CROSS JOIN (select 0 t1 union select 1 union select 2 union select 3 union select 4 union select 5 union select 6 union select 7 union select 8 union select 9) t1
   CROSS JOIN (select 0 t2 union select 1 union select 2 union select 3 union select 4 union select 5 union select 6 union select 7 union select 8 union select 9) t2
   CROSS JOIN (select 0 t3 union select 1 union select 2 union select 3 union select 4 union select 5 union select 6 union select 7 union select 8 union select 9) t3
   CROSS JOIN (select 0 t4 union select 1 ) t4
  ) v

   LEFT join audit_log as A
   on DATE_FORMAT( FROM_UNIXTIME(A.created_on), '%Y-%m-%d') = v.gen_date
   AND A.type = 'open' AND A.org_id=3

   where $__timeFilter(v.gen_date)

   GROUP BY  v.gen_date
   ORDER BY  v.gen_date ASC
And if you want hourly precision...
select UNIX_TIMESTAMP(v.gen_date) as time_sec,
...
  (select DATE_ADD( $__timeFrom(), INTERVAL t4*10000 + t3*1000 + t2*100 + t1*10 + t0  HOUR) gen_date from
...
  ) v

   LEFT join audit_log as A
   on DATE_FORMAT( FROM_UNIXTIME(A.created_on), '%Y-%m-%d %H:00:00') = v.gen_date
   AND A.msg = 'open' AND A.org_id=3
...
Note that the open and org_id clauses go in the JOIN. If you put them in the WHERE you'll end up back at the beginning with no 0 values.
One last bug
There seems to be a bug in Grafana's MySQL driver that won't let this exact query run. Guh! We need to take out the first $__timeFrom() and replace with with a hard-coded text date.
 (select DATE_ADD( $__timeFrom(), INTERVAL t4*10000 + t3*1000 + t2*100 + t1*10 + t0  DAY) gen_date from
-- should be
 (select DATE_ADD( '2018-01-1', INTERVAL t4*10000 + t3*1000 + t2*100 + t1*10 + t0  DAY) gen_date from